Просмотр новости
Найдите то, что Вас интересует
 Спутники
 РН
РН SpaceX
 Роскосмос
 NASA
NASA
СпутникиРНSpaceXРоскосмосNASAWhile 68% see the death penalty as morally justified for those committing murder, 59% say it doesn't deter serious crimes – and there are wide partisan gaps on both questions.
This Pew Research Center analysis examines views of the death penalty.
Why did we do this?Pew Research Center conducts research to help the public, media and decision-makers understand important topics. We have studied Americans’ views of politics and major policy issues for decades.
Learn more about Pew Research Center.
How did we do this?We surveyed 3,554 U.S. adults from July 6 to 12, 2026. Everyone who took part in this survey is a member of the Center’s American Trends Panel. The survey represents the views of the full U.S. adult population.
Here are the survey questions used for this analysis, the detailed responses and the survey methodology.
As the Trump administration and some states seek to expand the application of the death penalty, about two-thirds of Americans (66%) now favor the death penalty for people convicted of murder, while nearly a third (32%) oppose it.
Majorities favor the death penalty and say it is morally justified, yet many do not think it deters serious crimes
% who __ the death penalty for persons convicted of murder
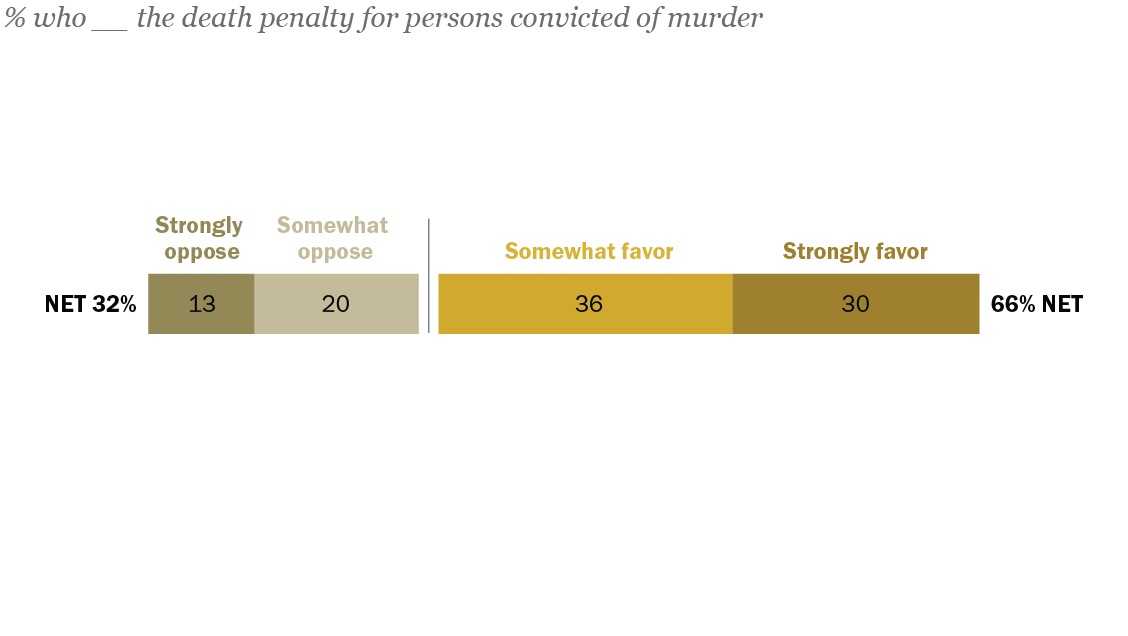
% who say …
Note: No answer responses are not shown.
Source: Survey of U.S. adults conducted July 6-12, 2026.
PEW RESEARCH CENTER
Majorities favor the death penalty and say it is morally justified, yet many do not think it deters serious crimes
% who __ the death penalty for persons convicted of murder
| Do you strongly favor, favor, oppose or strongly oppose the death penalty for persons convicted of murder? | % |
|---|---|
| Strongly favor | 30 |
| Somewhat favor | 36 |
| Somewhat oppose | 20 |
| Strongly oppose | 13 |
| Refused | 2 |
| NET Favor | 66 |
| NET Oppose | 32 |
| The death penalty DOES deter people from committing serious crimes | 39 |
| The death penalty DOES NOT deter people from committing serious crimes | 59 |
| When someone commits a crime like murder, the death penalty is morally justified | 68 |
| The death penalty is morally wrong, even when someone commits a crime like murder | 28 |
Note: No answer responses are not shown.
Source: Survey of U.S. adults conducted July 6-12, 2026.
PEW RESEARCH CENTER
Overall, support for the death penalty is 6 percentage points higher than it was five years ago, in April 2021 – though it is roughly equal to where it was in August of 2020 (65%).
A new Pew Research Center survey of 3,554 U.S. adults conducted July 6-12, 2026, also finds:
Support for the death penalty is up from 2021, though similar to 2019 and 2020
% who __ the death penalty for persons convicted of murder

Note: No answer responses are not shown.
Source: Survey of U.S. adults conducted July 6-12, 2026.
PEW RESEARCH CENTER
Support for the death penalty is up from 2021, though similar to 2019 and 2020
% who __ the death penalty for persons convicted of murder
| Date | NET Oppose | Strongly oppose | Somewhat oppose | Somewhat favor | Strongly favor | NET Favor | grouping |
|---|---|---|---|---|---|---|---|
| Sep ’19 | 34 | 15 | 19 | 33 | 32 | 65 | 1 |
| Jan ’20 | 36 | 15 | 21 | 32 | 30 | 62 | 1 |
| Aug ’20 | 34 | 14 | 20 | 35 | 30 | 65 | 1 |
| Apr ’21 | 39 | 15 | 24 | 32 | 27 | 60 | 1 |
| Jul ’26 | 32 | 13 | 20 | 36 | 30 | 66 | 2 |
Note: No answer responses are not shown.
Source: Survey of U.S. adults conducted July 6-12, 2026.
PEW RESEARCH CENTER
Greater support for death penalty in online panel surveys than telephone surveys
% who __ the death penalty for persons convicted of murder
Note: No answer responses are not shown.
Source: Survey of U.S. adults conducted July 6-12, 2026.
PEW RESEARCH CENTER
Greater support for death penalty in online panel surveys than telephone surveys
% who __ the death penalty for persons convicted of murder
| Group | Date | Favor (Phone) | Oppose (Phone) | Favor (ATP) | Oppose (ATP) |
|---|---|---|---|---|---|
| Total | 2015-03-29 | 56 | 38 | — | — |
| Total | 2016-09-02 | 49 | 42 | — | — |
| Total | 2018-05-01 | 54 | 39 | — | — |
| Total | 2019-09-15 | — | — | 65 | 34 |
| Total | 2019-09-16 | 55 | 40 | — | — |
| Total | 2020-01-13 | 53 | 42 | — | — |
| Total | 2020-01-19 | — | — | 62 | 36 |
| Total | 2020-08-02 | — | — | 65 | 34 |
| Total | 2020-08-04 | 52 | 44 | — | — |
| Total | 2021-04-11 | — | — | 60 | 39 |
| Total | 2026-07-12 | — | — | 66 | 32 |
| Rep/Lean Rep | 2015-03-29 | 74 | 20 | — | — |
| Rep/Lean Rep | 2016-09-02 | 72 | 21 | — | — |
| Rep/Lean Rep | 2018-05-01 | 74 | 20 | — | — |
| Rep/Lean Rep | 2019-09-16 | 78 | 19 | — | — |
| Rep/Lean Rep | 2019-09-15 | — | — | 84 | 15 |
| Rep/Lean Rep | 2020-01-13 | 75 | 22 | — | — |
| Rep/Lean Rep | 2020-01-19 | — | — | 80 | 18 |
| Rep/Lean Rep | 2020-08-02 | — | — | 83 | 16 |
| Rep/Lean Rep | 2020-08-04 | 74 | 23 | — | — |
| Rep/Lean Rep | 2021-04-11 | — | — | 77 | 23 |
| Rep/Lean Rep | 2026-07-12 | — | — | 84 | 15 |
| Dem/Lean Dem | 2015-03-29 | 42 | 53 | — | — |
| Dem/Lean Dem | 2016-09-02 | 34 | 58 | — | — |
| Dem/Lean Dem | 2018-05-01 | 36 | 56 | — | — |
| Dem/Lean Dem | 2019-09-16 | 36 | 59 | — | — |
| Dem/Lean Dem | 2019-09-15 | — | — | 49 | 50 |
| Dem/Lean Dem | 2020-01-13 | 34 | 62 | — | — |
| Dem/Lean Dem | 2020-01-19 | — | — | 46 | 52 |
| Dem/Lean Dem | 2020-08-02 | — | — | 49 | 51 |
| Dem/Lean Dem | 2020-08-04 | 32 | 63 | — | — |
| Dem/Lean Dem | 2021-04-11 | — | — | 46 | 53 |
| Dem/Lean Dem | 2026-07-12 | — | — | 51 | 48 |
Note: No answer responses are not shown.
Source: Survey of U.S. adults conducted July 6-12, 2026.
PEW RESEARCH CENTER
The data in the most recent survey, collected from Pew Research Center’s predominantly online American Trends Panel (ATP), finds that 66% of Americans favor the death penalty for persons convicted of murder. Over five ATP surveys conducted since September 2019, there have been relatively modest shifts in these views – from a low of 60% seen in April 2021 to a high of about two-thirds in September 2019, August 2020 and now.
Before Pew Research Center shifted most of our domestic surveys to the ATP, we conducted most of our polling by phone, and we had long tracked public views on this issue. During the transition from telephone surveys to the ATP, Pew Research Center conducted phone surveys between September 2019 and August 2020 with field periods nearly identical to ATP surveys. The phone surveys found support for the death penalty that was significantly lower than in the online surveys: 55% favored the death penalty in September 2019, 53% in January 2020 and 52% in August 2020 – 9 to 13 percentage points lower than the ATP surveys conducted around the same time. The consistency of this difference points to substantial mode effects on this question.
As a result, survey results from online surveys are not directly comparable with the Center’s past telephone survey trends or with other organizations’ trends that are collected by telephone. An analysis from 2021 provides further details on the mode differences seen on this question. And for more on mode effects and the transition from telephone surveys to online panel surveys, read “What our transition to online polling means for decades of phone survey trends” and “Trends are a cornerstone of public opinion research. How do we continue to track changes in public opinion when there’s a shift in survey mode?”
As in the past, there are wide partisan gaps in views of the death penaltyRepublicans and independents who lean toward the Republican Party overwhelmingly support the death penalty (84% say they’re in favor), including about half (47%) who strongly favor it. Democrats and Democratic leaners are about equally split between support (51%) and opposition (48%).
Wide gaps between Republicans and Democrats on racial disparities, morality of death penalty

Source: Survey of U.S. adults conducted July 6-12, 2026.
PEW RESEARCH CENTER
Wide gaps between Republicans and Democrats on racial disparities, morality of death penalty
| Group | Dem/Lean Dem | Total | Rep/Lean Rep | grouping |
|---|---|---|---|---|
| Total who favor the death penalty | 51 | 66 | 84 | total |
| other | ||||
| When someone commits a crime like murder, the death penalty is morally justified | 55 | 68 | 85 | other |
| White people and Black people are equally likely to be sentenced to the death penalty | 23 | 48 | 77 | other |
| The death penalty does deter people from committing serious crimes | 25 | 39 | 55 | other |
| There are adequate safeguards to ensure that no innocent person will be put to death | 14 | 25 | 38 | other |
Source: Survey of U.S. adults conducted July 6-12, 2026.
PEW RESEARCH CENTER
Partisan differences extend to views of the death penalty’s fairness, moral justification and effectiveness as a crime deterrent.
Republicans and Democrats are most divided over whether the death penalty is fairly applied across racial lines: 77% of Republicans say White and Black people are equally likely to be sentenced to the death penalty for similar crimes, but just 23% of Democrats say the same.
Most Republicans (85%) also say the death penalty is morally justified for a crime like murder. Democrats are more closely split on this question – 55% say it’s morally justified, and 42% say it’s not. (Democrats who support the death penalty overwhelmingly say it is morally justified, while those who oppose it say it is not. Visit the appendix for more details on how supporters and opponents of the death penalty view its administration.)
In contrast, Republicans are somewhat split over the death penalty’s role as a deterrent for serious crime (55% say it deters crime, 43% say it does not). Democrats overwhelmingly reject the death penalty as an effective crime deterrent (25% say it deters crime, 73% say it doesn’t).
Majorities of both Republicans (60%) and Democrats (84%) say there is some risk that an innocent person will be put to death. But Republicans (38%) are more likely than Democrats (14%) to say there are adequate safeguards in place to prevent that.
Views of the death penalty by ideology, race and ethnicity, education, and age IdeologyIdeological divisions over the death penalty are wider within the Democratic Party than the Republican Party.
Black Americans, those with graduate degrees and liberal Democrats are more likely than others to oppose the death penalty
% who __ the death penalty for persons convicted of murder

* Asian adults are representative of English speakers only.
Note: White, Black and Asian adults include those who report being one race and are not Hispanic; Hispanics are of any race. No answer responses are not shown.
Source: Survey of U.S. adults conducted July 6-12, 2026.
PEW RESEARCH CENTER
Black Americans, those with graduate degrees and liberal Democrats are more likely than others to oppose the death penalty
% who __ the death penalty for persons convicted of murder
| Group | Strongly favor | Somewhat favor | Somewhat oppose | Strongly oppose | NET Favor | NET Oppose | grouping |
|---|---|---|---|---|---|---|---|
| Total | 30 | 36 | 20 | 13 | 66 | 32 | total |
| White | 34 | 36 | 16 | 12 | 70 | 28 | race |
| Hispanic | 25 | 37 | 21 | 14 | 62 | 35 | race |
| Black | 16 | 32 | 32 | 15 | 49 | 48 | race |
| Asian* | 25 | 41 | 25 | 7 | 65 | 32 | race |
| Ages 18-29 | 22 | 37 | 25 | 16 | 59 | 41 | age |
| 30-49 | 29 | 36 | 21 | 11 | 66 | 33 | age |
| 50-64 | 31 | 38 | 16 | 11 | 70 | 27 | age |
| 65+ | 35 | 33 | 16 | 14 | 67 | 30 | age |
| Postgraduate | 17 | 36 | 25 | 21 | 52 | 46 | edu |
| College grad | 26 | 36 | 23 | 14 | 62 | 38 | edu |
| Some college | 33 | 36 | 20 | 9 | 69 | 29 | edu |
| HS or less | 35 | 36 | 15 | 11 | 71 | 26 | edu |
| Rep/Lean Rep | 47 | 37 | 10 | 5 | 84 | 15 | rep |
| Conserv | 54 | 33 | 8 | 5 | 87 | 12 | rep |
| Mod/Lib | 36 | 45 | 13 | 4 | 81 | 18 | rep |
| Dem/Lean Dem | 15 | 36 | 29 | 19 | 51 | 48 | dem |
| Cons/Mod | 20 | 42 | 26 | 11 | 62 | 38 | dem |
| Liberal | 9 | 28 | 34 | 28 | 38 | 62 | dem |
* Asian adults are representative of English speakers only.
Note: White, Black and Asian adults include those who report being one race and are not Hispanic; Hispanics are of any race. No answer responses are not shown.
Source: Survey of U.S. adults conducted July 6-12, 2026.
PEW RESEARCH CENTER
Most liberal Democrats (62%) oppose the death penalty for people convicted of murder. A majority of conservative and moderate Democrats take the opposite position (62% favor the death penalty).
Conservative Republicans are modestly more supportive of the death penalty (87%) than moderate and liberal Republicans (81%), but both groups support it by wide margins.
Race and ethnicitySupport for the death penalty also varies across racial and ethnic groups, with majorities of White, Hispanic and Asian adults favoring it. Black adults are split (49% favor, 48% oppose).
EducationAdults with a college degree, especially those with a postgraduate degree, are less likely than others to favor the death penalty for people convicted of murder.
AgeYounger adults are modestly less supportive of the death penalty than older adults. About six-in-ten adults ages 18 to 29 favor the death penalty, compared with roughly seven-in-ten who favor it among older groups.
Demographic differences in support for the death penalty within the partiesDeep divisions on the death penalty among Democrats across education levels
% who say they favor the death penalty for persons convicted of murder

* Asian adults are representative of English speakers only.
Note: White, Black and Asian adults include those who report being one race and are not Hispanic; Hispanics are of any race. Black Republicans are a very small share of the population, so their responses cannot be shown separately.
Source: Survey of U.S. adults conducted July 6-12, 2026.
PEW RESEARCH CENTER
Deep divisions on the death penalty among Democrats across education levels
% who say they favor the death penalty for persons convicted of murder
| Group | Dem/Lean Dem | Total | Rep/Lean Rep | grouping |
|---|---|---|---|---|
| Total | 51 | 66 | 84 | total |
| White | 48 | 70 | 87 | race |
| Hispanic | 59 | 62 | 78 | race |
| Black | 44 | 49 | — | race |
| Asian* | 59 | 65 | 82 | race |
| Postgraduate | 36 | 52 | 81 | edu |
| College degree | 44 | 62 | 84 | edu |
| Some college | 56 | 69 | 84 | edu |
| HS or less | 60 | 71 | 87 | edu |
* Asian adults are representative of English speakers only.
Note: White, Black and Asian adults include those who report being one race and are not Hispanic; Hispanics are of any race. Black Republicans are a very small share of the population, so their responses cannot be shown separately.
Source: Survey of U.S. adults conducted July 6-12, 2026.
PEW RESEARCH CENTER
Among those who associate with the Democratic Party, support for the death penalty varies by education and by race and ethnicity. Republicans’ views do not vary much across these lines.
There are wide education gaps among Democrats, but not Republicans.
Six-in-ten Democrats with a high school education or less favor the death penalty, as do 56% of those with some college experience but without a bachelor’s degree. By comparison, 40% of those with a bachelor’s degree or higher say this, including just 36% of Democrats with a postgraduate degree.
White (48%) and Black Democrats (44%) are less likely than Hispanic and Asian Democrats (59% among both) to say they favor the death penalty. Support for the death penalty is high among Republicans regardless of race or ethnicity, yet there is a modest gap between White and Hispanic Republicans in their support.
Visit the appendix for additional graphics on how views about the death penalty’s moral justification, crime deterrence, racial fairness and administration vary by age, education, and racial and ethnic groups.
| # | Наименование новости | Тональность | Информативность | Дата публикации |
|---|---|---|---|---|
| 1 | What the data says about abortion in the U.S. | 0 | 7 | 17-06-2026 |
| 2 | Опрос: более половины американцев одобряют политику Байдена | 0 | 0 | 25-04-2021 |
| 3 | Большинство избирателей США считает, что вакцина от COVID-19 разрабатывается поспешно | 0 | 0 | 06-09-2020 |
| 4 | В США 57% опрошенных не хотят участия Трампа в выборах, если ему предъявят обвинения | 0 | 0 | 30-03-2023 |
| 5 | More Americans are being put to death | -5 | 6 | 24-11-2025 |
| 6 | Программа Трампа по депортации нелегальных мигрантов теряет поддержку американцев | 0 | 0 | 21-07-2025 |
| 7 | Федеральные власти США возобновят смертные казни | 0 | 0 | 25-07-2019 |
| 8 | Война на Ближнем Востоке | 0 | 16.1 | 03-04-2026 |
| 9 | В ПАСЕ призвали федеральные власти США отказаться от решения вернуть смертную казнь | 0 | 0 | 02-08-2019 |